How to properly measure network performance
Performance is one of the most important aspects of networking. In fact, it is an important part of virtually any system. Any network administrator knows how quickly everyone blames the network when the performance of any type of device or system connected to the network leaves something to be desired. When this happens, it is often up to the network administrator to prove that the network is performing to specification and that the source of the performance degradation is elsewhere.
How come? Simply by measuring performance using industry standard technologies. Today, we are looking to measure the performance of the network.

We will start by talking network performance in general. If we are to talk about measuring something, we must first agree on what we are trying to measure. This will bring us to the next and most important topic: how to measure network performance. Although there are several ways to do this, Simple Network Management Protocol (SNMP) is probably the most widely used technology to measure network performance. So we are going to take a deep look at SNMP. Finally, we'll take a look at some of the best tools currently available for measuring network performance.
About network performance
As eloquently defined in a Wikipedia sentence, "network performance refers to measures of the quality of service of a network as seen by the customer." There are three essential elements for this definition. The first is the "measures" part. It makes it clear that network performance needs to be measured. The next important element is the “quality of service of a network”. Quality of service is a generic concept but, as you will see, some specific metrics are often associated with it. The last important element of this definition is "the customer". We are not interested in the performance of the network as something theoretical, but in the how users perceive it .
Several different factors affect the perceived performance of the network and are generally considered important. The first two are bandwidth and performance. Sometimes there can be some confusion between these two terms. Bandwidth refers to the load capacity of a network. By analogy, think of it as the number of lanes on a highway. Performance, on the other hand, refers to the actual usage of available bandwidth. To keep our analogy above, think of a four-lane highway that has a bandwidth of 4 vehicles per hour, but its current throughput is 000 vehicles per hour or 400% of its capacity.
Latency, lag, and jitter are the factors that most affect perceived network performance. Latency refers to the time it takes for data to travel from source to destination. It is primarily a function of the signal travel time and the processing time at any node it passes through. It is a physical limitation that cannot be reduced. Lag, on the other hand, can sometimes be improved. It has to do with the time it takes for network equipment to process, queue, and transfer data. Faster, more powerful equipment will generally add less delay to the transmission. As for jitter, it refers to the variation of the packet delay at the end of reception of the conversation.Real-time or near-real-time traffic is particularly affected, as it can cause out-of-order data packets to arrive. In the case of voice over IP, for example,
Many other factors can also affect network performance . The error rate is one of them. It refers to the number of corrupted bits expressed as a percentage or fraction of the total sent.
Network performance measurement
How do you measure performance from the point of view of the real user? Of course, there is a possibility for real users to test, but it can be quite impractical. The next best option is to use a network performance testing system that uses probes deployed at strategic locations in your network and can run real mock tests against each other to measure real performance using types. specific traffic. However, it can also be impractical as it requires some preliminary setup. Helping to solve a sudden problem won't be much help.
Un SNMP-based network monitoring system simpler is generally a better solution. While not as convenient, it can give administrators a fairly clear view of network usage. Good systems will also account for most of the factors that affect performance, such as latency, lag, jitter, and errors.
READ ALSO: Top 6 network management tools that monitor performance
The simple network management protocol
Despite its misleading name, Simple Network Management Protocol, or SNMP, can be quite complex . Fortunately, you don't have to be an expert and know everything to use it. Basically, SNMP is a communication protocol that specifies how an SNMP management system can read and write operational parameters to remote devices. The parameters are called OID, for object identifiers. Some of the interesting OIDs, from a monitoring standpoint, are those that contain critical metrics like bandwidth usage, for example. When monitoring network devices, two OIDs are of particular interest, the output bytes and count bytes associated with each interface.Network devices automatically increment these counters as data is sent and entered.
From a time when IT security was not an issue, SNMP has only had minimal security. An SNMP manager is connecting to an SNMP compatible device will transmit a "community string" with your request. If the string matches the one configured on the device, the request will be made. Devices typically have two community strings configured, one for read-only OIDs and one for editable OIDs.
This is how the most surveillance systems use SNMP to monitor bandwidth usage. Periodically, they read the input and output byte counters of a network device's interfaces at known intervals, with five minutes being a typical value. Then they store the recovered values in some kind of database or disk file. The rest of the process is simple math. The monitoring system subtracts the previous counter value from the current value to obtain the number of bytes transmitted or received in five minutes. Then you can multiply that number by eight to get the number of bits and divide it by 300, the number of seconds in five minutes, to get the number of bits per second.This information is generally plotted on a graph which shows its evolution over time and is stored in a database.
The best tools to measure network performance
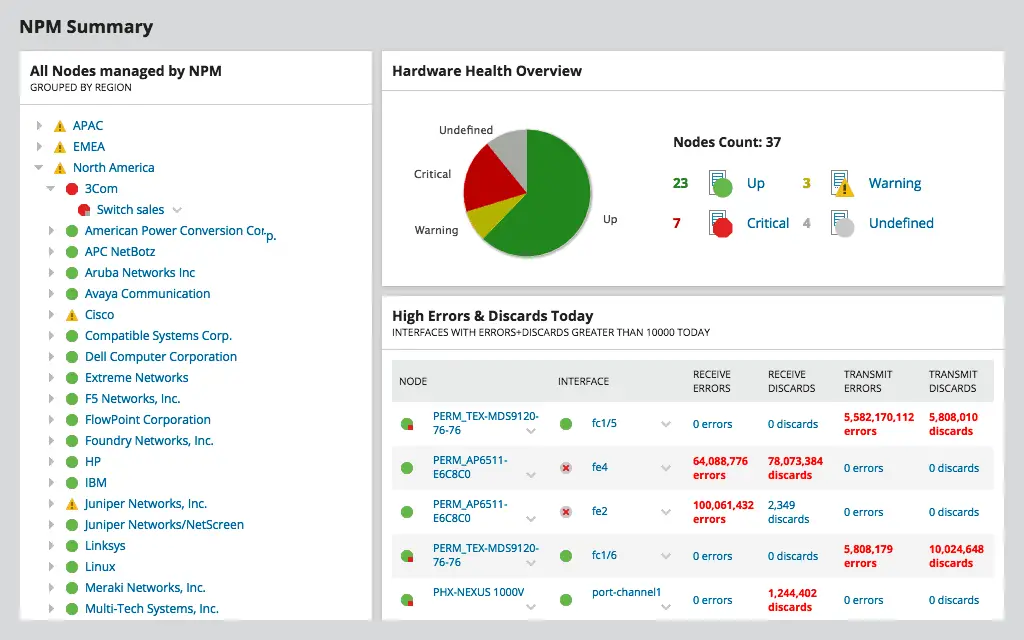
1. SolarWinds Network Performance Monitor (FREE TRY )
Solarwinds has a solid reputation for creating some of the best system and network management tools. Many of the company's products have received rave reviews and are considered among the best in their respective fields. More Solarwinds is also famous for its free tools, smaller tools that meet a specific need of network administrators. Two good examples of these free tools are the real-time bandwidth monitor and Kiwi Syslog server .
However, to monitor networks, you need SolarWinds Network Performance Monitor ( NPM ) , which is primarily an SNMP monitoring tool. Essentially, it offers full fault monitoring and performance management via SNMP and is therefore compatible with most equipment. It also comes with many advanced features, such as its function NetPath , which allows you to view the critical network path between two monitored points on your network. It can also automatically generate smart grid maps.
- FREE TRY: SolarWinds Network Performance Monitor
- Official download link: https://www.solarwinds.com/network-performance-monitor/registration
The other features of NPM include advanced alerts and le dashboard performance analysis PerfStack of tool . Another advanced feature that enables complex device monitoring is Network Insights functionality. The tool can monitor software-defined networks (SDNs) and has built-in support for Cisco ACI, as well as the ability to monitor wireless networks and generate network performance benchmarks. Le Performance Monitor SolarWinds Network is a highly scalable tool that can be used on any network, from the smallest to the largest.
La tariff structure of SolarWinds Network Performance Monitor is pretty straightforward. The license is based on the number of monitored items. Five license levels are available for 100, 250, 500, 2000 and unlimited items at prices ranging from $ 2 to $ 955, including the first year of maintenance.
If you prefer to test the tool before committing to a purchase, you can get a free 30-day trial .
2. PRTG Network Monitor
Le PRTG Network Monitor de Paessler AG is a network monitoring system agentless . Paessler says PRTG Network Monitor can be configured in minutes. Our experience shows that it may take a bit longer than that, but it's still very quick and easy, thanks to an Autodiscover feature that will scan your network, find devices, and add them automatically. The tool uses a combination of Ping, SNMP, WMI, NetFlow, jFlow, sFlow, but it can also communicate via DICOM or RESTful API.
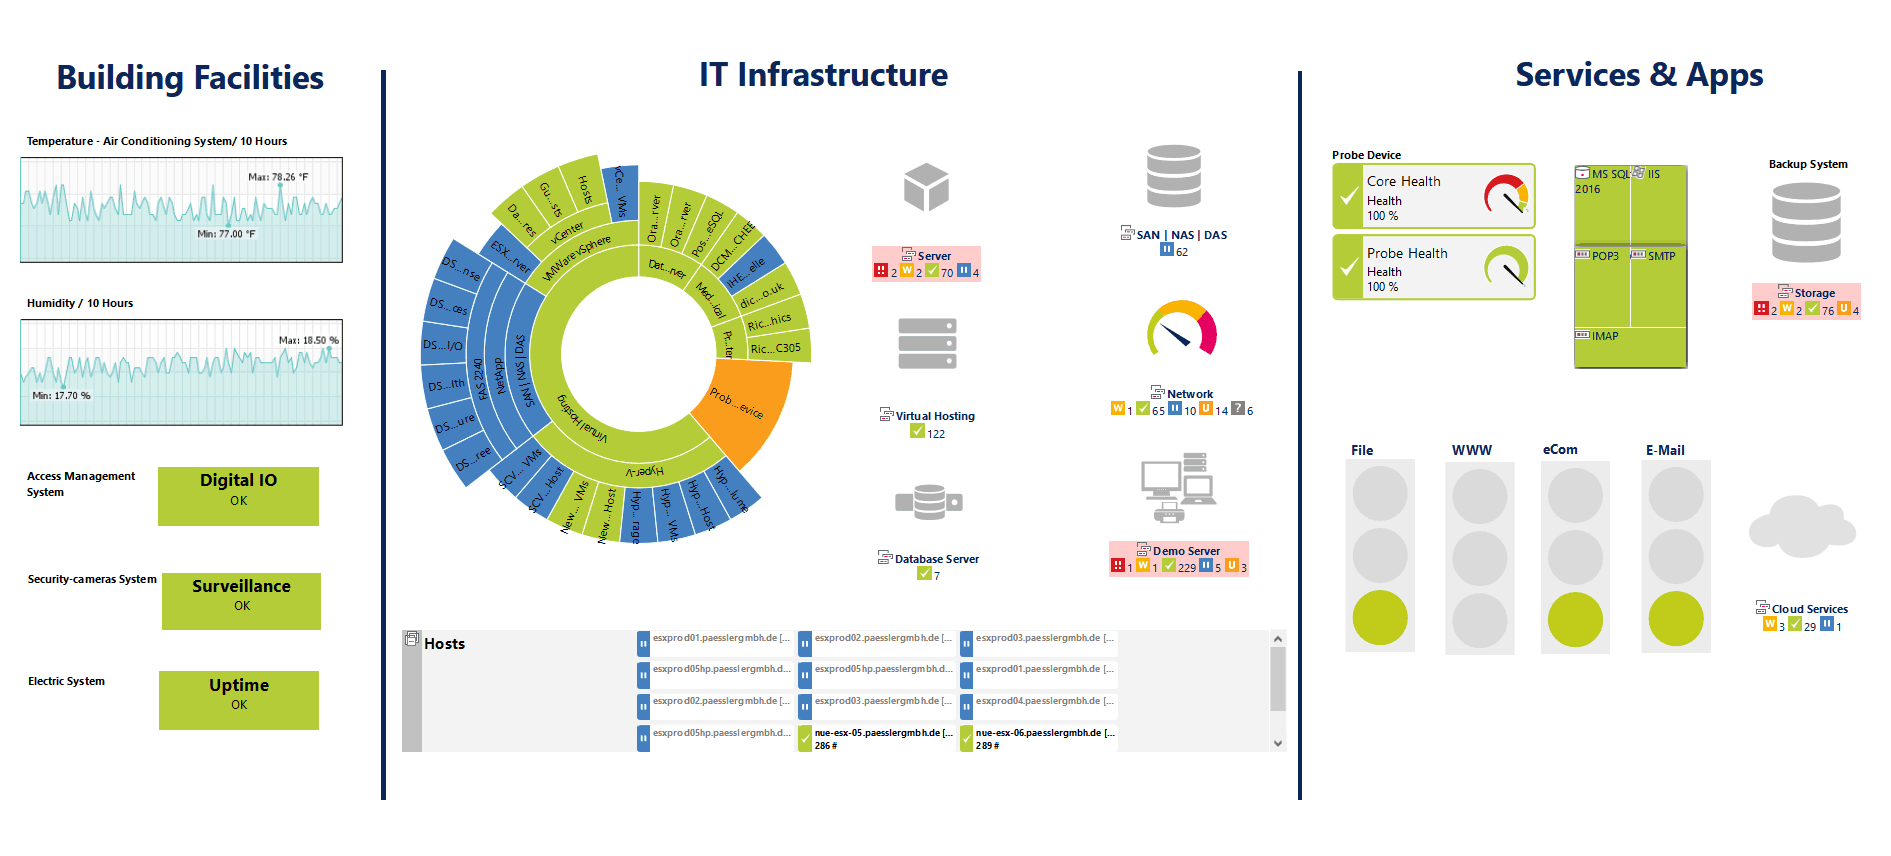
One of the strengths of PRTG Network Monitor is its sensor-based architecture. You can think of sensors as add-ons to the product, except that they are already included and do not need to be added. There are plugins for almost everything. For example, there are HTTP, SMTP / POP3 (email) application sensors. There are also hardware-specific sensors for switches, routers, and servers. In total, there are over 200 different predefined sensors that collect statistics such as response time, processor, memory, database information, temperature or system status of monitored devices.
Le PRTG Network Monitor offers a selection of user interfaces. The main one is an Ajax based web interface. There is also a Windows enterprise console, as well as mobile apps for Android and iOS. A cool feature of mobile apps is that they can use push notifications of any alert triggered by PRTG . More standard SMS or email notifications are also available. Although the server only runs on Windows, it can be managed from any device with an Ajax compatible browser.
Le PRTG network monitor is offered in two versions. There is a full free version, but it will limit your monitoring capacity to 100 sensors. Note that each monitored parameter counts as one sensor and, for example, the 24 monitor interfaces on a network switch will use up to 24 sensors. If you need more than 100 sensors, you need to purchase a license. Their prices start at $ 1 for 600 sensors. You can also get a free 30-day, sensorless and full trial.
3. ManageEngineOpManager
Le ManageEngineOpManager is a complete management solution that will take care of the most of your needs monitoring. The tool can be run on Windows or Linux and is packed with cool features. For example, its Autodiscover feature can graphically map your network, giving you a unique personalized dashboard.
The tool board is another of its strengths. It is very easy to use and navigate and has an exploration feature. If you like mobile apps, they are available for tablets and smartphones and will allow you to access the system from anywhere. Overall, this is a very polished and professional product.
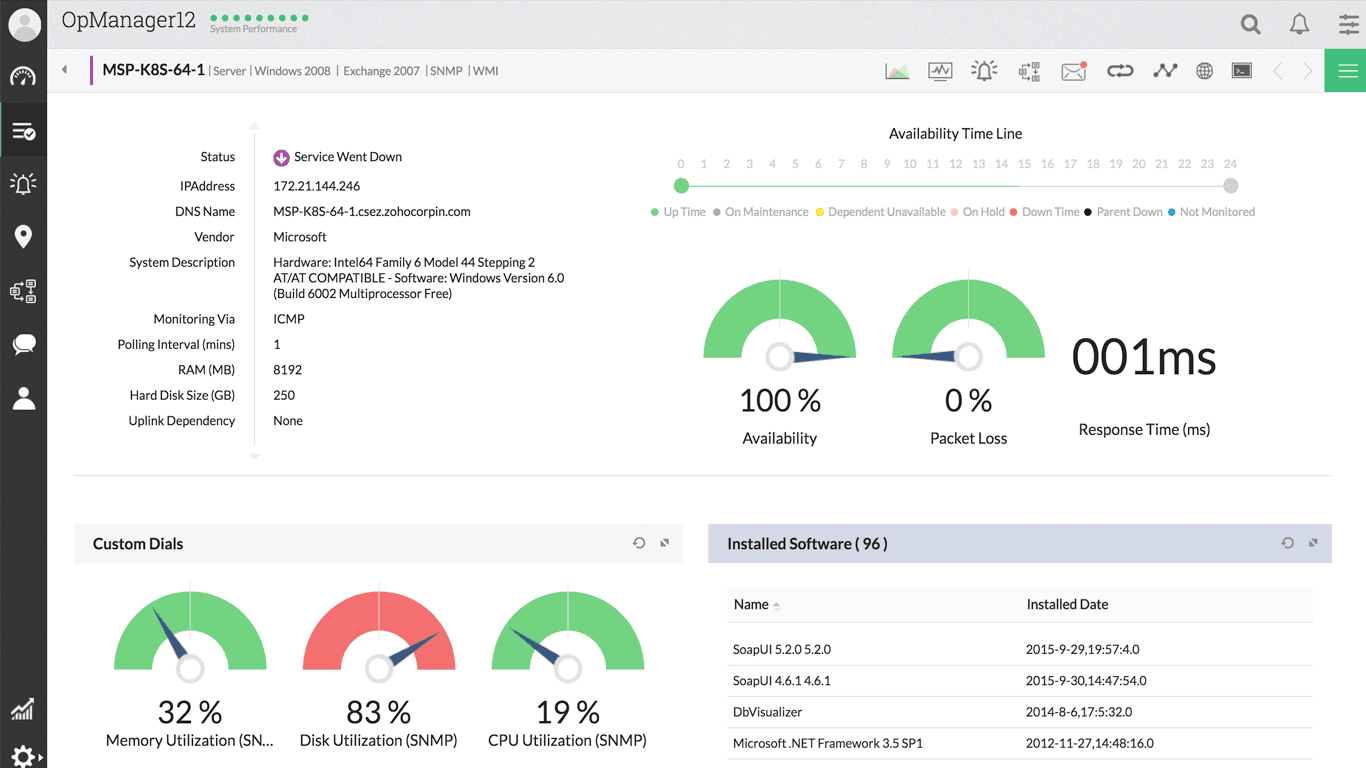
The alert in OpManager is another of the strengths of the product. There is a comprehensive suite of threshold-based alerts to help detect, identify, and resolve network issues. Multiple thresholds can be defined with multiple claims for each performance metric.
If you want to try ManageEngineOpManager , get the free version. This is not a trial version for a limited time. Instead, it has limited functions. For example, it will not allow you to monitor more than ten devices. While this may be sufficient for testing purposes, it will only support small networks. For more devices, you can choose between Essential or Enterprise plans. The first will allow you to monitor up to 1 nodes while the other goes up to 000. Pricing information is available by contacting the ManageEngine sales department.
4. WhatsUp Gold
WhatsUp Gold is another name known in the field of surveillance tools. It used to be a type of bottom-up or top-down monitoring tool, but has grown into a comprehensive management tool with proactive monitoring of network traffic, applications, virtual environments, and device configurations. Today, this tool has pretty much everything you would expect from an enterprise level monitoring tool and is available through a very intuitive graphical interface.
WhatsUp Gold has an autodiscover engine that will find your devices and add them to the monitoring console. N